The figures below show the number of newly incorporated companies on a quarterly basis.

The number of incorporations continue to increase with the second quarter showing an 11.31% increase on quarter two of 2025.
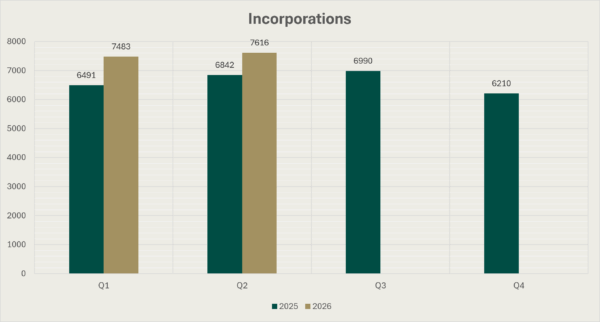
Bar Chart of Incorporations during the four quarters of 2025 and first two quarters of 2026. The figure for Q1 2025 is 6491, for Q2 2025 it is 6842, for Q3 2025 it is 6990, for Q4 2025 it is 6210, for Q1 2026 it is 7483 and for Q2 2026 it is 7616
 
Incorporations by Company Type

Company Type 2025 Q1 2026 Q1 2025 Q2 2026 Q2 2025 Q3 2026 Q3 2025 Q4 2026 Q4
CLG – Company Limited by Guarantee 178 229 228 266 240 161
CLG – Company Limited by Guarantee (licenced company) 3 3 7 6 3 8
DAC – Designated Activity Company (limited by guarantee) 1 1 2 1 3 2
DAC – Designated Activity Company (limited by shares) 215 217 228 256 249 237
External company 47 67 56 47 44 36
IC – Investment Company – Part 24 Companies Act 2014 1 0 0 1 0 0
LTD – Private Company Limited by Shares 5,996 6,920 6,274 6,996 6,409 5,685
PLC – Public Limited Company 4 3 0 0 0 0
Societas Europaea – Transfer into State 2 2 1 0 1 1
ULC – Private Unlimited Company 44 41 46 43 41 80


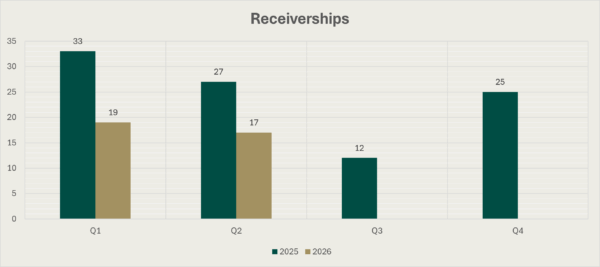
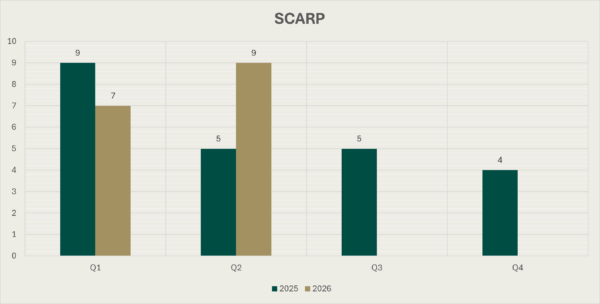
This series of bar charts show the figures for Examinership, Small Companies Administrative Rescue Process (SCARP), and Receiverships.

Please note: The figures reported below may increase in the future, i.e. if a Notice of Appointment on a Receiver an effective date during Q1, but the CRO was only notified during Q4, the Q1 figure would be retroactively increased.
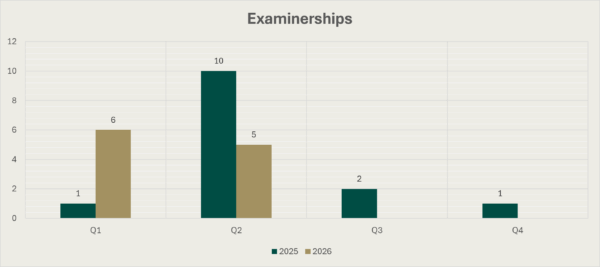
Bar Chart of examinerships during the four quarters of 2025 and the first two quarters of 2026. The figure for Q1 2025 is 1, for Q2 2025 it is 10, for Q3 2025 it is 2, for Q4 2025 it is 1 , for Q1 2026 it is 6 and for Q2 2026 it is 5.

Bar Chart of Receiverships during the four quarters of 2025 and the first two quarters of 2026. The figure for Q1 2025 is 33, for Q2 2025 it is 27, for Q3 2025 it is 12, for Q4 2025 it is 25 , for Q1 2026 it is 19 and for Q2 2026 it is 17.

“Bar Chart of SCARP during the four quarters of 2025 and the first two quartesr of 2026. The figure for Q1 2025 is 9, for Q2 2025 it is 5, for Q3 2025 it is 5, for Q4 2025 it is 4, for Q1 2026 it is 7 and for Q2 2026 it is 9.

The figures below provide a breakdown of the notifications of liquidations, that took effect during the time period, and have been received and registered by the CRO.

Please Note: The figures reported below may increase in the future, i.e. if a Liquidation had an effective date during Q1, but the CRO was only notified during Q4, the Q1 figure would be retroactively increased.
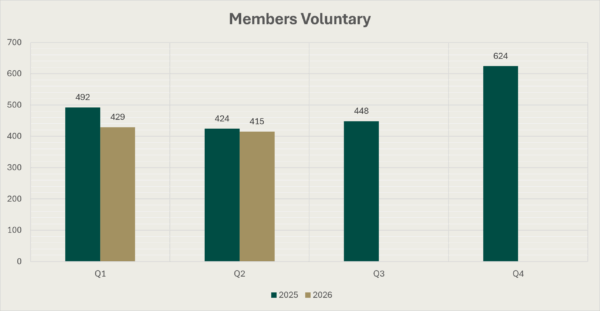
Bar Chart of Members Voluntary for the four quarters of 2025 and the first two quarters of 2026. For Q1 2025 the figure is 492, for Q2 2025 it is 424, for Q3 2025 it is 448, for Q4 2025 it is 624 , for Q1 2026 it is 429 and for Q2 2026 it is 415.

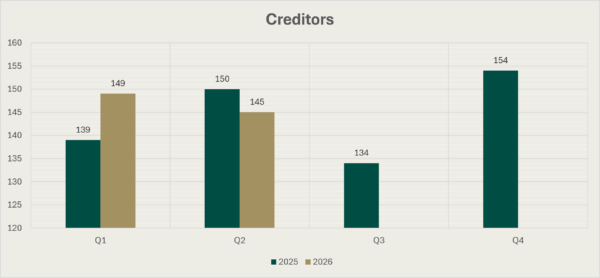
Bar Chart of Creditors for the four quarters of 2025 and the first two quarters of 2026. The figure for Q1 2025 is 139, for Q2 2025 it is 150, for Q3 2025 it is 134, for Q4 2025 it is 154, for Q1 2026 it is 149 and for Q2 2026 it is 145.

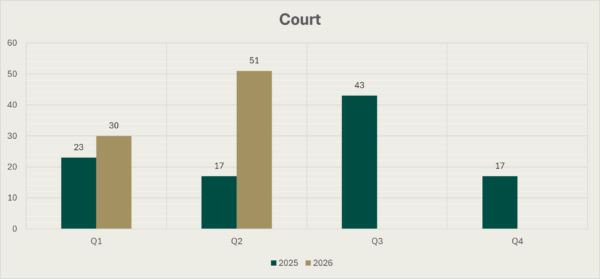
Bar chart covering Court for the four quarters of 2025 and the first two quarter of 2026. The figure for Q1 2025 is 23, for Q2 2025 it is 17, for Q3 2025 it is 43, for Q4 2025 it is 17 , for Q1 2026 it is 30 and for Q2 2026 it is 51.

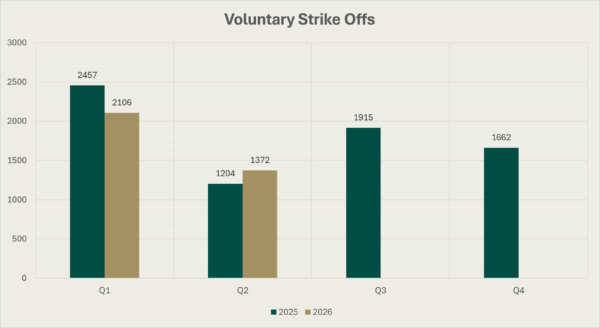
Bar Chart of voluntary strike offs during the four quarters of 2025 and the first two quarters of 2026. The figure for Q1 2025 is 2457, for Q2 2025 it is 1204, for Q3 2025 it is 1915, for Q4 2025 it is 1662 , for Q1 2026 it is 2106, and for Q2 2026 it is 1372.

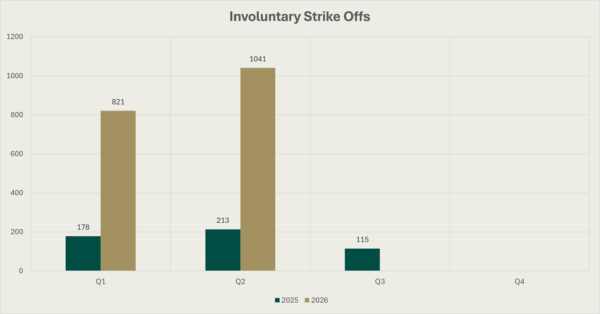
Bar Chart of involuntary strike offs during the four quarters of 2025 and the first two quarters of 2026. The figure for Q1 2025 is 178, for Q2 2025 it is 213, for Q3 2025 it is 115, for Q4 2025 it is 0, Q1 2026 it is 821 and for Q2 2026 it is 1041.

The Companies Registration Office (CRO) processes numerous types of submission during the life cycle of a company. The table below outlines the number of submissions received for the most frequently filed submissions:

  • B1: Annual Return
  • B2: Change of registered office
  • B10: Change of director and/or secretary, or in their particulars
  • B73: Nomination of a new annual return date
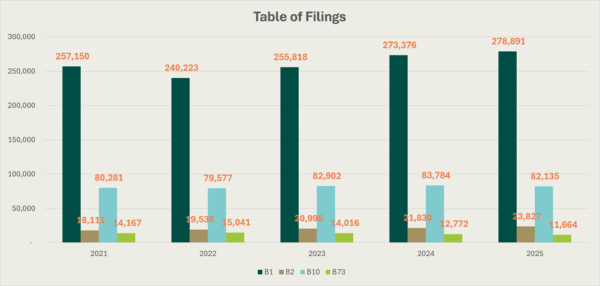
 
Bar Chart covering the period 2021 to 2025 showing the number of filings for B1, B2, B10 and B73. For 2021 the figure for B1 is 257,150, for B2 it is 18,111, for B10 it is 80,281 and for B73 it is 14,187. For 2022 the figure for B1 is 240,223, for B2 it is 19,536, for B10 it is 79,577 and for B73 it is 15,041. For 2023 the figure for B1 is 255,818, for B2 it is 20,988, for B10 it is 82,902 and for B73 it is 14,016. For 2024, the figure for B1 is 273,376, for B2 it is 21,830, for B10 it is 83,784 and for B73 it is 12,722. For 2025 the figure for B1 is 278,91, for B2 it is 23,827, for B10 it is 82,135 and for B73 it is 11,664.